Post by Sarah Turnbull, Centre for Criminology, University of Oxford. Follow her on Twitter @SL_Turnbull.
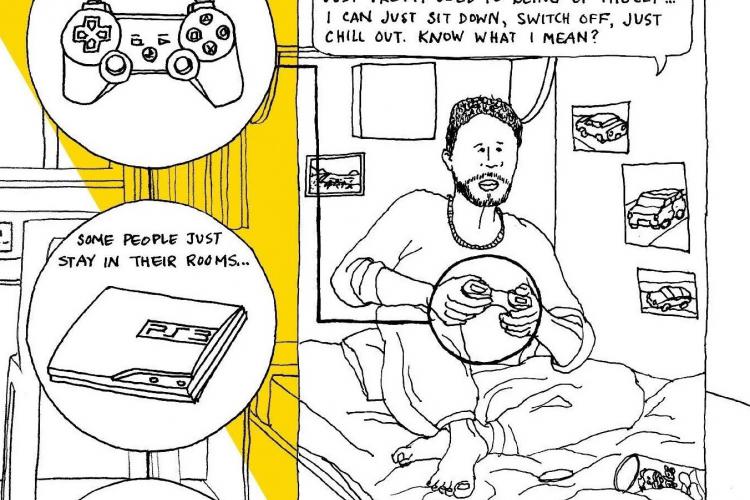
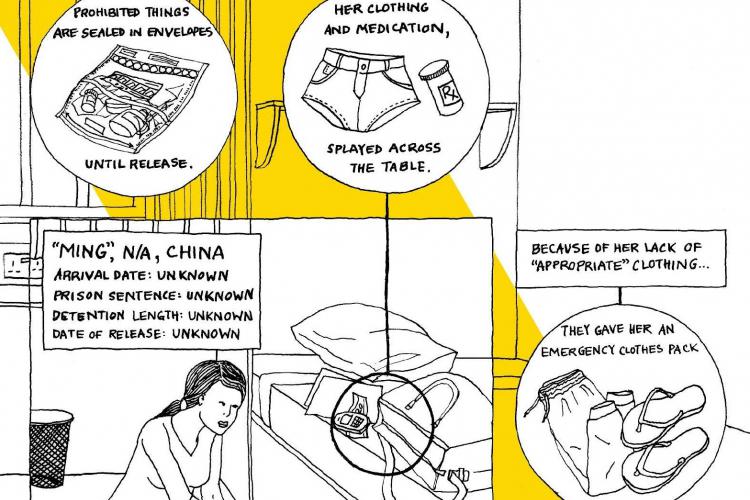
I recently had the privilege of working with multidisciplinary artist Tings Chak, author of the fabulous book Undocumented: The Architecture of Migrant Detention, for a piece in the March-April 2016 issue of The Funambulist Magazine on the theme of ‘Carceral Environments.’ Our collaborative article, ‘Migrant Detention: Stories from the United Kingdom,’ is based on data from my ethnographic research on immigration detention carried out in the UK. Tings, who is trained in architecture and is an experienced migrant justice organiser, was well-placed to understand the qualitative data I’ve collected to create a piece capturing the complexities of immigration detention in the UK while humanising those who are subject to this form of state power. (Images 1 and 2 below are excerpts from the article.)
The collaborative approach to developing The Funambulist article started in a coffee shop in Toronto where we had an exchange of ideas and materials: Tings showing me some graphic novels and other artistic and critical approaches to social and political commentary, and me showing her some of the photographs I had taken in detention with Mary Bosworth (see here) and the sorts of data I had collected during my fieldwork. From there, we communicated over email and Skype to iron out some of the details, including which informants and stories to profile and how to do so. Tings and I brainstormed some aspects of detention to visualise and then I looked through my dataset, pulling excerpts from fieldnotes and interviews to share with her as well as participants’ drawings of their cells. A key issue we encountered was how best to represent the data and whether some fictionalising of the details was okay. We decided to stick to what the data were telling us, while recognising that the data are always imperfect as they are partial, incomplete, and reflect my interpretation of events as I observed and recorded them.
Why integrate visuals into the academic study of immigration detention? ‘Data visualisation’—that is, the visual representation of ‘numeric and non-numeric data through the use of static or interactive pictures and graphics’—is one way for qualitative researchers such as myself to reach wider audiences (e.g., non-academics, policy-makers, migrant communities, NGOs, etc.) and increase accessibility to academic research by using visual expressions. Images can be very powerful and often can connect emotionally with audiences in ways that words cannot―and here the devastating image of Aylan Kurdi comes to mind as a galvanising force (even as its power has ebbed over time).
I see data visualisation as connected to the use of visual methodologies in approaches to studying border control and the criminalisation of mobility—something we’ve been trying to do with Border Criminologies. For instance, Mary and Khadija von Zinnenburg Carroll have been working to develop the Immigration Detention Archive while exploring the creation of art and material culture in detention (see here), and criminology DPhil student Alice Gerlach gave cameras to women who had been deported to Jamaica during her fieldwork there. I’ve also attempted to use the method of ‘photo-voice’ as part of my research into life after detention (see here, for example).
Working with Tings was a great opportunity to present some of the qualitative data for my research project in what I think is a powerful way. Visual representations do something that words or numbers alone often cannot, often connecting to emotions and experiences that cannot easily be articulated. The stories depicted in The Funambulist piece offer a glimpse into the hidden world of life in detention in an engaging and accessible way. Indeed, immigration detention centres are difficult places to access, for researchers, activists, and journalists alike. For members of the public that don’t know much about these spaces or the individuals contained therein, it’s important for different sorts of materials to be available to both show what detention is like and humanise those subject to this form of border control. In the UK, Detention Action’s #FreedVoices campaign and the Detention Forum’s #Unlocked tour of the detention estate via Twitter spring to mind as two creative ways to open up these institutions.
It’s the humanising power of Tings’ drawings that I’m most happy with in our collaboration. The inclusion of stories of detainees with criminal histories aims to disrupt the deserving/undeserving binary that often emerges in discussions of immigration detention. And in depicting people’s belongings and how they pass time, the stories provide a glimpse of the lives lived behind the walls and fences, reminding us that there are human beings within.
Any comments about this post? Get in touch with us! Send us an email, or post a comment here or on Facebook. You can also tweet us.
__________
How to cite this blog post (Harvard style):
Turnbull, S. (2016) Visualising Immigration Detention Data: A Collaborative Approach. Available at: https://www.law.ox.ac.uk/research-subject-groups/centre-criminology/centreborder-criminologies/blog/2016/06/visualising (Accessed [date]).
With the support of