Cross-border Corporate Mobility Through the Prism of More Than a Decade of Empirical Data
Posted:
Time to read:
5 Minutes
How has cross-border corporate mobility in the European Union (‘EU’) and European Economic Area (‘EEA’) been doing over the last twenty years? What degree of integration exists via cross-border mergers, cross-border conversions, cross-border seat transfers of Societas Europaea (‘SEs’), as well as creations of SEs? Whilst datasets have been available in the area of M&A for a long time, a dataset on cross-border corporate mobility has recently also been made available (the ‘Report’) , which is timely in the context of the new EU Company Mobility Package.
Overall, the Report shows that cross-border corporate mobility is a phenomenon of the 21st century: integration in the form of a freedom of establishment for companies through corporate mobility exists only since this millennium and has increased steadily since the early 2000s. The question remains, however, whether a fully permeable internal market for corporate mobility exists in the EU/EEA. Based on the current data, a conclusive answer cannot be provided yet. But the observable concentration of cross-border company mobility to a few countries such as Germany, the Netherlands and Luxembourg suggest that full integration has not yet been achieved.
For the period between 2000 and 2019, 4,305 cross-border mergers (‘CBMs’), 553 cross-border conversions (‘CBCs’), 158 SE cross-border seat transfers (‘SE CBSTs’) and 19 cross-border divisions (‘CBDs’) could be identified as well as 3,229 creations of SEs or, all together, 8,364 individual cases. That means that the majority of the cases are CBMs (51.4%), followed by the creations of SEs (39.8%), CBCs (6.6%), SE CBTs (1.8%) and finally CBDs (0.2%).
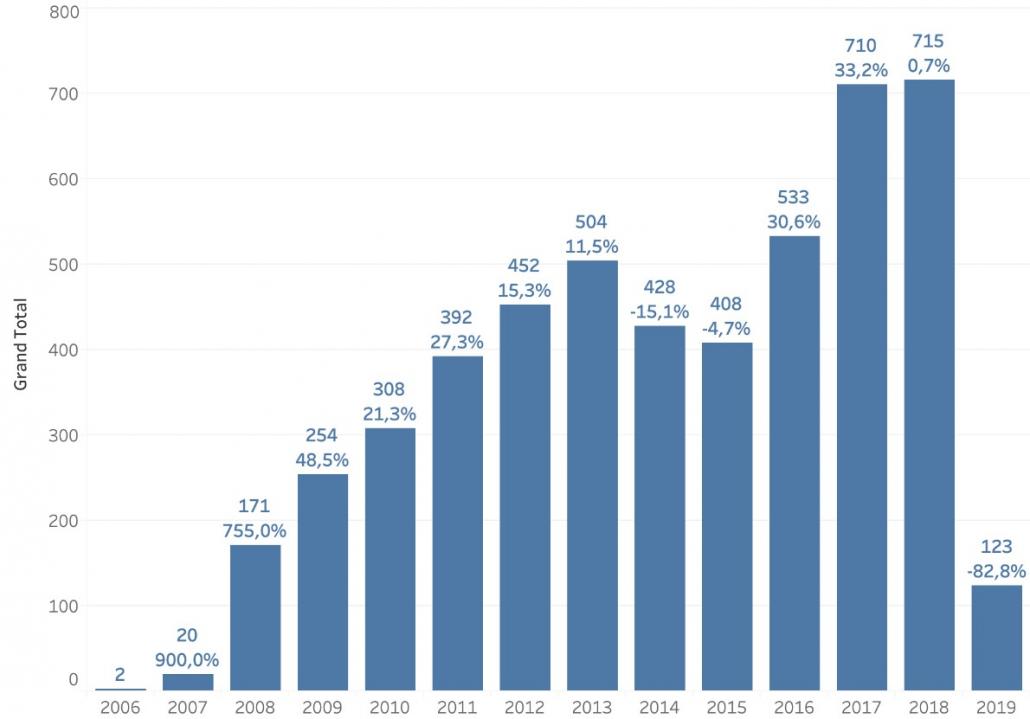
Figure 1: Aggregated overview of cross-border transactions (excluding SE-formations) in the EU/EEA per year (both entry and exit cases combined) (N= 5,020)
Taking the 10-year period between 2008 and 2018 for all types of company mobility (excluding SE formations), an average growth rate of 15.38% per year can be seen for cross-border transactions starting from 171 transactions in 2008 to 715 transactions in 2018. The overall growth rate has been 318%. For CBMs individually, the annual growth rate amounts to 12.82% (from 159 transactions in 2008 to 532 transactions in 2018) and the overall growth rate for CBMs for the same 10-year period has been 234%. For CBCs, the number has risen from zero CBCs that could be identified for the year 2008 to 162 that have been identified for the year 2018. SE CBSTs have increased from 12 transfers in 2008 to 20 transfers in 2018, ie an increase of 66% overall or an annual growth rate of 5.24%. The number of CBDs has increased marginally. For 2008 no CBD could yet be identified, whereas 2 CBDs could be identified for 2019.
From a country-by-country perspective, the three countries with the highest number of cross-border corporate mobility transactions overall when considering entry and exit cases together are Germany, the Netherlands and Luxembourg. It is noteworthy that these three countries are the only ones that have more than 1,000 CBM transactions and more than 200 CBC transactions. That results in Germany, the Netherlands and Luxembourg being the only countries with more than 1,000 cross-border corporate mobility transactions overall, respectively 1,593 transactions for Germany, 1,434 transactions for the Netherlands and 1,345 transactions for Luxembourg. Considering that 10,107 transactions were identified (counting entry and exit cases together), Germany covers 15.7% of all transactions, the Netherlands 14.1% and Luxembourg 13.3%. That means the three countries combine 43.1% of all cross-border corporate mobility transactions (excluding the formation of SEs). It has to be noted, however, that a transaction is counted as entry transaction for one country and exit transaction for the other country involved (i.e. the total number of reported cases is 200% in this section).
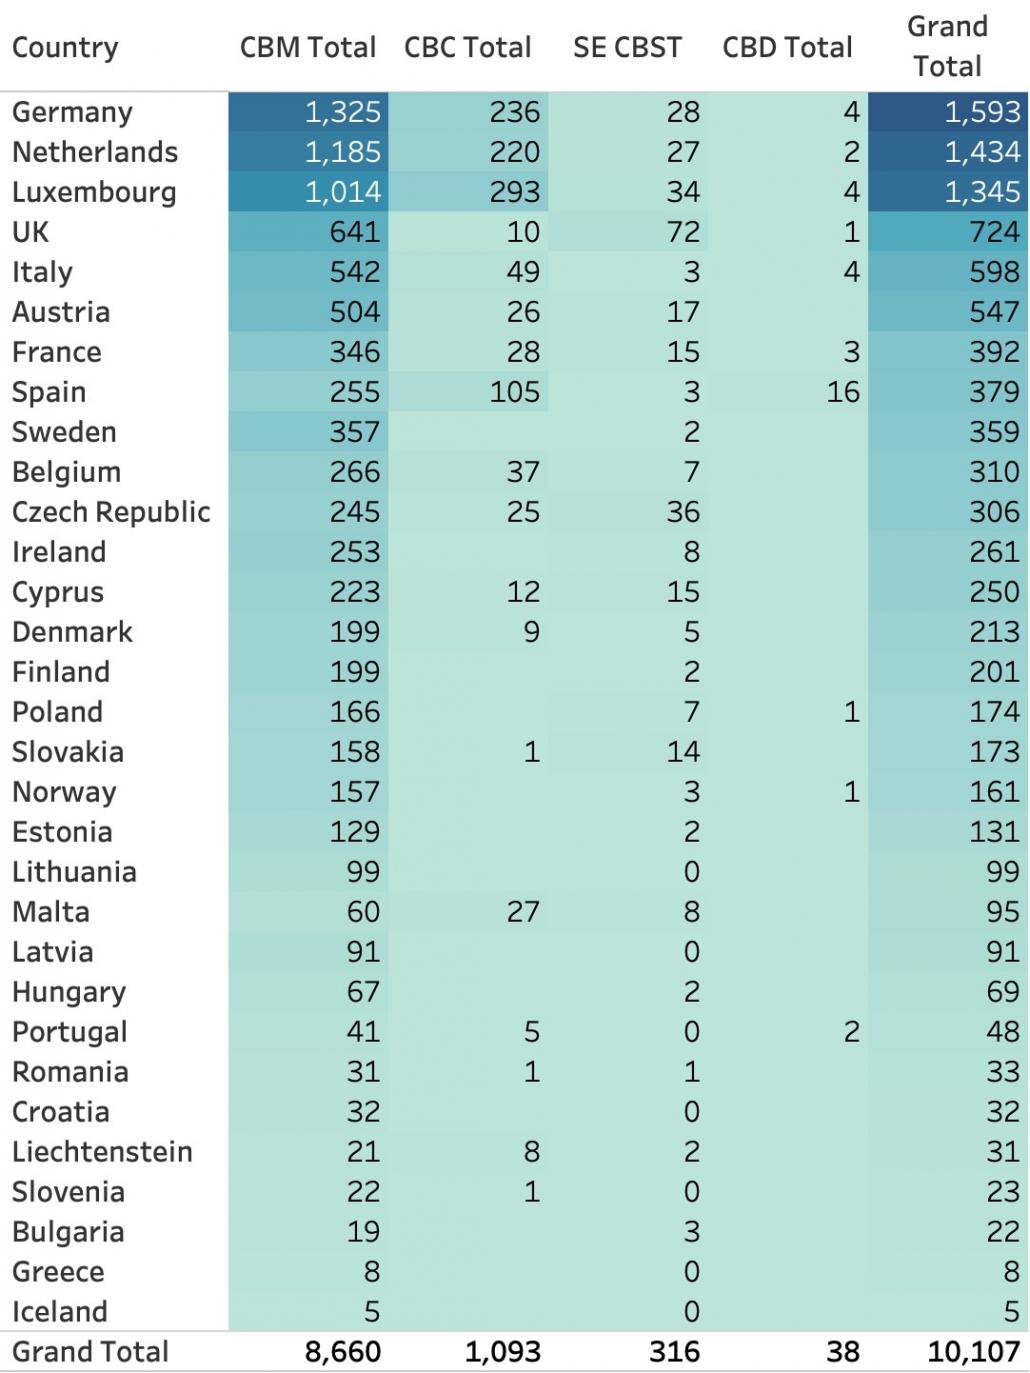
Figure 2: Aggregated overview of cross-border transactions in the EU/EEA per country (both entry and exit cases combined) (N= 10,107). In this overview, transactions to and from third countries are included in the reporting.
At the bottom of the list are several countries for which less than 50 cross-border corporate mobility transactions could be identified, namely Iceland (5), Greece (8), Bulgaria (22), Slovenia (23), Liechtenstein (31), Croatia (32), Romania (33) and Portugal (48). Combined, they cover 202 cross-border corporate mobility transactions, which is 1.9% of the overall number of transactions identified.
In terms of net balances between Member States, the country with the highest positive net balance (i.e. countries where, by operation of cross-border transactions, more companies enter than leave) was Germany (271 transactions), followed by Luxembourg (240) and Italy (200). Further countries with a positive net balance are, inter alia, Finland (59), Estonia (55), Czech Republic (50) and France (32).
The country with the highest negative net balance was the Netherlands (-434 transactions), followed by the United Kingdom (-111) and Austria (-100). Further countries with negative net balances are, inter alia, Slovakia (-71), Lithuania (-59), Hungary (-55), Poland (-54) and Ireland (-49). This picture of the net balances is, however, heavily influenced by the number of CBM transactions. For example, Germany has the highest positive net balance for CBMs with 249 transactions, whereas it only ranks fifth for positive net balances for CBCs (with a positive net balance of 20 CBCs). For SE CBTs, Germany has a net balance of 0 and only ranks 17th and, for CBDs, Germany ranks 2nd with a positive net balance of 4 CBDs. For the Netherlands, one has to note that the country ranks consistently at the bottom of the list. It has a negative net balance of 241 CBM transactions (ranking last), a negative net balance of 182 CBC transactions (ranking last), a negative net balance of 9 SE CBTS (ranking second to last) and finally a negative net balance of 2 for CBDs (ranking second to last).
In terms of most frequent combinations between countries, for CBMs these are usually companies exiting the United Kingdom and entering Germany as location of the acquiring company, with a total of 200 transactions. This is followed by Germany as exit (merging company) location and Luxembourg as entry (acquiring company) location (192), the combination of Netherlands as exit location and Luxembourg as entry location (183), Austria as exit location and Germany as entry location (162) and, finally, the pair of the Netherlands as exit location and Germany as entry location (121).
The highest number of CBCs takes place between Luxembourg and Germany. In 85 CBCs, a company governed by the laws of Germany has converted into a company governed by the laws of Luxembourg and in 64 cases a company governed by the laws of Luxembourg has converted into a company governed by the laws of Germany.
Also frequent are CBCs in which a company governed by the laws of the Netherlands converts into a company governed by the laws of Luxembourg (52 CBSTs) or by the laws of Germany (58 CBSTs). It is noteworthy that 58 companies governed by the laws of the Netherlands have converted into a company governed by the laws of Spain and 18 into a company governed by the laws of Malta. Other combinations of Member States involve Luxembourg as an exit country and Italy as an entry country (20 CBSTs), Austria as an exit country and Germany as an entry country (14 CBSTs).
The company law form most often involved in cross-border corporate mobility is a private LLC, followed by a public LLC. For CBMs, 71.23% of the company forms involved are private LLCs, 25.60% are public LLCs, 1.60% SEs and 1.58% fall within the category ‘other’. For CBCs, 87.91% of the companies involved are private LLCs, 10.26 % are public LLCs and 1.83% fall within the category ‘other’. In CBDs, 52.63% of the companies involved have the form of a private LLC and 47.36%, have the form of a public LLC.
For readers interested in a (much) more detailed overview of the data as well as for those who are interested in the methodology, please consult the Report here.
Thomas Biermeyer is Assistant Professor at the Faculty of Law at Maastricht University and Senior Associate at Wildgen Luxembourg.
Marcus Meyer is Assistant Professor at the Public Law Department of the Faculty of Law at Maastricht University.
OBLB types:
Research
OBLB keywords:
Cross-border corporate mobility
Empirical research
Cross-border mergers
Cross-border divisions
Cross-border conversions
Jurisdiction:
European Union
Share: