Seven years ago today, on May 6, 2010, the US equity market had its Flash Crash. Major stock indices in cash equities and equity futures dropped by 5-6% in a matter of minutes, before rebounding quickly. As history would repeat itself, similar Flash Crashes happened to the 10-year US Treasury note on October 15, 2014 and to the British Pound on October 7, 2016. Remarkably, studies and reports following each event have trouble identifying a clear fundamental cause or driver. Instead, these events prompted many to ask whether our electronic markets have become ‘too fast’.
But how fast is too fast? My recent article with Songzi Du (Simon Fraser University) proposes a simple formula to answer this question. With minimum input, the formula computes the optimal trading frequency of any asset traded on exchanges or exchange-like marketplaces. Specifically, for a fixed time interval, say one second, the optimal number of batch auctions to be held in this time interval is approximately:
(nα/2-1/3)μ,
where
- µ is the number of ‘events’ or ‘news’ during the time interval that affect the value of the asset;
- n is the number of active market participants in this market during the time interval;
- α is a numerical value between 0 and 1, and it is decreasing in the degree of 'adverse selection’ in the asset (ie, some investors know more than others about its fundamental value).
Here, optimality is measured in allocative efficiency, that is, the degree to which assets are moved to the most efficient holders as fast and completely as possible.
Where does the formula come from? The derivation involves technical details, but the basic tradeoff is the following. A higher trading frequency enables investors to reallocate the assets sooner after new information arrives, but a lower trading frequency leads to a deeper market and a higher volume of beneficial trades. For instance, as markets become faster over the past decade, the reaction of prices to new information has become more immediate, but transaction sizes have declined steadily. The optimal trading frequency strikes the best balance between these two considerations.
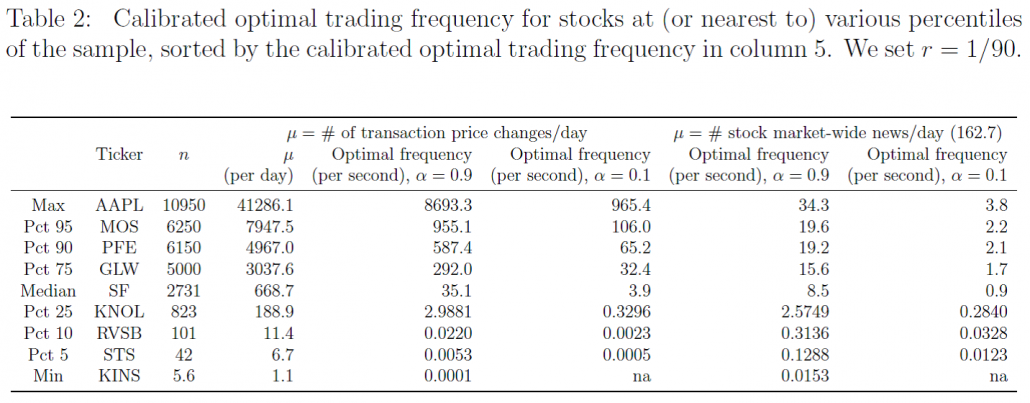
The following two tables, taken from our research, provide a quantitative assessment of the optimal trading frequency for a sample of US futures contracts and stocks.
Table 1 calibrates the optimal trading frequency of four liquid US futures contracts: E-mini S&P 500, 10-year US Treasury, Euro, and crude oil. These contracts have a broad investor base (large n) and relatively symmetric information among investors about their fundamental values (α close to 1). If any change in transaction prices is considered ’news’, the calibrated optimal trading frequency for these four futures contracts is in the order of milliseconds or tens of milliseconds per auction. If we only count news articles that are published and distributed, the calibrated optimal trading frequency is in the order of several auctions per second. While the range of estimates is wide, there does not seem to be a definitive case to be made for slowing down the market significantly.

Source: Du and Zhu (2016)
Table 2 computes the optimal trading frequency for a stratified sample of US stocks. As before, the news arrival frequency can be calibrated to the average number of transaction price changes per second or the average number of news articles related to that particular stock per second. For individual stocks, adverse selection is more relevant, so we also consider low degrees of adverse selection (α = 0.9) and high degrees of adverse selection (α = 0.1). As the top five rows show, large-cap and medium-cap stocks tend to have an optimal trading frequency ranging from a few auctions per second to a few thousand auctions per second. Again, there is no definitive case to slow down the market here.

Source: Du and Zhu (2016)
On the other hand, the results are very different for small- and micro-cap stocks, shown in the last three rows of Table 2. The optimal trading frequency for these stocks is generally slower than one auction per second. For some stocks, it is as slow as one auction per several minutes or several hours. For instance, the optimal frequency of 0.0001 means one auction per 10,000 seconds, or 2 hours and 48 minutes!
A broad conclusion from this exercise is that if speed regulation or innovation were to be implemented, it makes the most sense to start with assets or derivatives that have narrow investor participation or infrequent news arrivals, such as small-cap or micro-cap stocks. Moreover, while the calibration does not recommend a clear slowdown of the market for liquid securities, it does not recommend a further speed-up, either. Millisecond-level trading seems sufficiently fast.
Given appropriate data, the same calibration can be conducted on options, exchange-traded funds (ETFs), government securities, foreign exchange, and other instruments traded electronically.
Seven years after the Flash Crash in US stock markets, the tide on the speed race seems to be ebbing and turning. On June 17, 2016, the SEC approved IEX’s exchange application and stated that any delay below one millisecond is de minimis, that is, too minor to matter. Since then, stock exchanges such as the NYSE and NASDAQ proposed their own ‘speed bumps’. In FX markets, innovations that moderately slow down trading have started from at least 2013, when EBS experimented with batching orders on the AUD/USD exchange rate that arrive within a small time interval. The time is ripe for continued market design in the speed dimension to better serve investors.
Haoxiang Zhu is an Assistant Professor of Finance at the MIT Sloan School of Management.
OBLB categories:
OBLB types:
Share:
